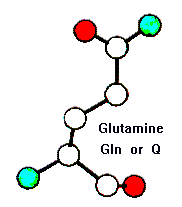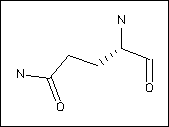

The top of each page shows to images (e.g. Glutamine):


On the left is a ball-and-stick representation, where the spheres denote the relative sizes of the atoms, and the colours denote type (white = carbon; blue = nitrogen, red = oxygen, yellow = sulphur). The main chain atoms (protein backbone) are shown at the bottom of the figure.
On the right is a 2D chemical representation of the molecule. Here, unlabelled vertices denote carbons, N nitrogens, O oxygens and S sulphur atoms. Dashed lines indicate bonds going into the page, wedges bonds coming out of the page. In these diagrams, the main chain atoms are usually (though not always) to the right of the image.
The next section shows how the amino acid substitutes for all other amino acids. Four different contexts are considered:
For each context, Favoured, Neutral and Disfavoured substitutions are listed. The numbers after each amino acid are the log odds scores associated with changing the amino acids. This is calculated by analysis of a lot of protein alignments for each context. Positive numbers imply a prefered change, zero implies a neutral change, and negative numbers imply a deleterious change (un-prefered).
Subsitution preferences for all protein types come from the standard BLOSUM62 matrices (Henikoff & Henikoff, Amino acid substitution matrices from protein blocks, PNAS, 89, 10915-10919, 1992; PubMed) used in Blast and other programs. For membrane proteins they come from Jones, Taylor & Thornton, A mutation data matrix for transmembrane proteins. FEBS Lett. 339, 269-275, 1994. (PubMed). Those for intracellular and extracelluar proteins were created by Rob Russell & Rich Copley by building BLOSUM type matrices using the SMART database, considering "extracellular" and "signalling" domains to represent extracellular and intracellular environments.
Thanks to Barbara Gomez for pointing out some discrepencies between published matrices and those used here (specifically in the membrane protein matrix). I am not completely sure what the explanation is, but I suspect it is to do with updates to the datasets used in derivation. For this reason, I would not be surprised to see minor differences. If people notice any that are more severe, please let me know.
What follows after this is a discussion of the various features of the amino acid, with descriptions of its involvement in structure and function.